Dashboard
The Dashboard provides an overview of license information, user metrics, and request analytics in a visual format.
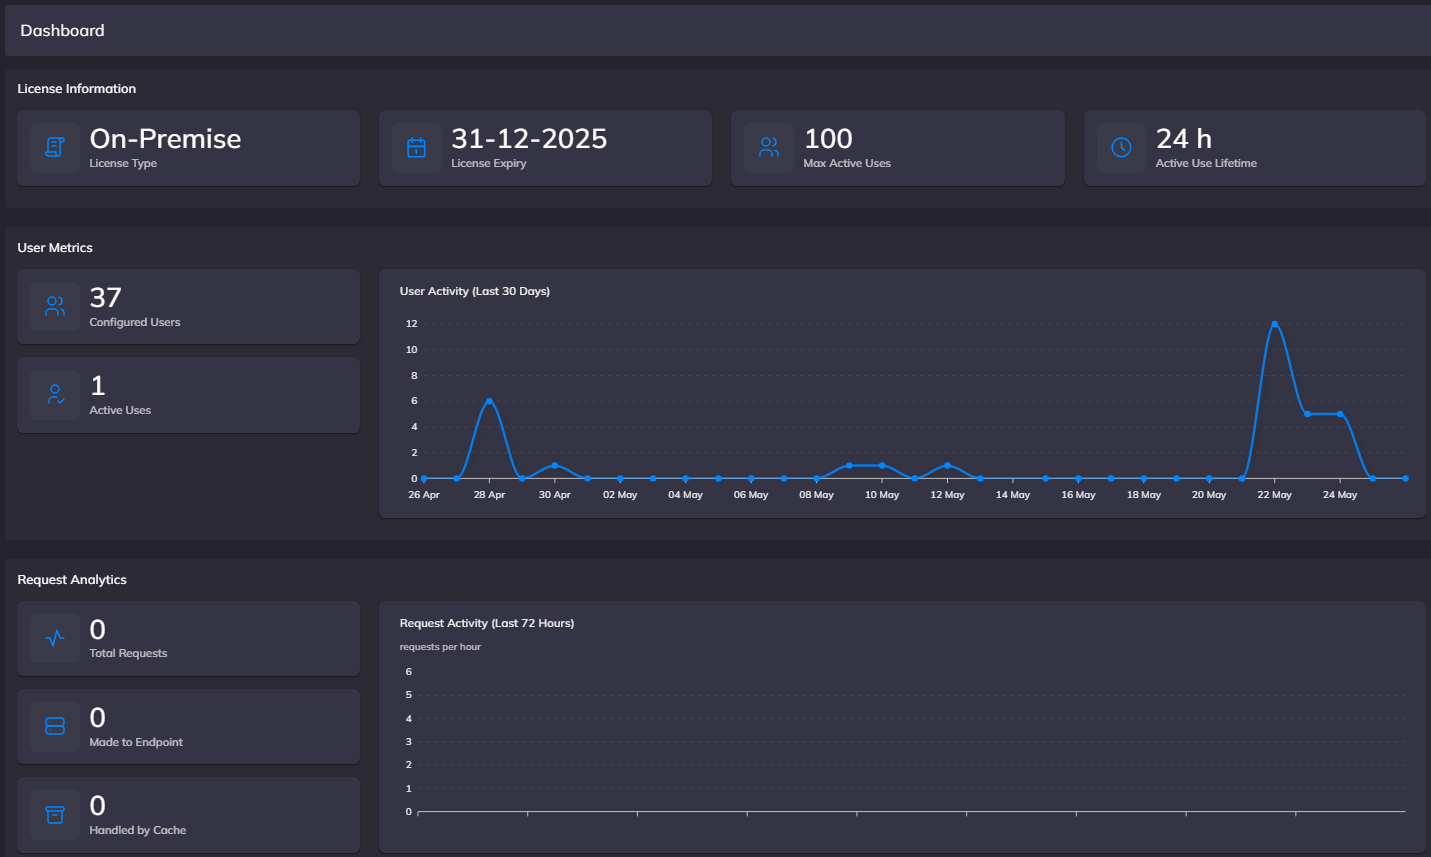
Screenshot: The Administration Dashboard showing license information, user metrics with activity graph, and request analytics with hourly request patterns
License Information
The top section displays key license details:
- License Type: Shows your deployment type (On-Premise/Cloud)
- License Expiry: Displays the expiration date (format: DD-MM-YYYY)
- Max Active Uses: Indicates the maximum number of active user sessions permitted under your license
- Active Use Lifetime: Shows how long user sessions remain active (24h)
User Metrics
The middle section provides user statistics:
- Configured Users: Total number of users set up in the system
- Active Uses: Current number of active user sessions
- User Activity Graph: Visual representation of user activity over the last 30 days, showing daily usage patterns
Request Analytics
The bottom section offers detailed request statistics:
- Total Requests: Cumulative number of requests processed by the system
- Made to Endpoint: Number of requests successfully routed to endpoints
- Handled by Cache: Number of requests processed through the cache
- Request Activity Graph: Visual chart showing hourly request rates over the past 72 hours
The dashboard is designed to help administrators monitor system usage, track license utilization, and analyze request patterns for better resource management.
Updated: 2025-05-27